Ticker
Timer Lab
Please turn in the assignment in this order:
1. Pre-lab questions
2. Graphical Analysis for Pre-Lab question 7a and 7b
3. Graphical Analysis for Actual Lab Data (notice you have to use GA twice, once for the pre-lab data and once for the actual lab)
4. Post-Lab questions
Here is how I am going to grade this assignment:
25 points for neatness/organization of the lab and data table
15 points for the GA print out
30 points for correctly answering the pre-lab questions
30 points for correctly answering the post-lab questions.
Total: 100 points
IB students: Please check how to do this as an IB lab write-up you have an additional week to complete this assignment.
Ticker Timer Lab
Purpose: In this lab you will be using a “ticker timer” which taps with a frequency of 60 taps/second to determine the acceleration of gravity on an object. The symbol for the acceleration of gravity is “g”.
Pre-Lab
activities and questions:
Read the statements and then answer the lettered questions beneath each
statement.
1. Pull a small length (about 1 m long) of ticker tape through the timer quickly – but consistently (in other words, try not to change your speed of pull, make the speed constant).
a. What do you notice about
the spacing between the dots?
2. Pull a small length (about 1 m long) of ticker tape through the timer slowly – but consistently (in other words, try not to change your speed of pull, make the speed constant).
a. What do you notice about
the spacing between the dots?
3. Frequency (represented by the letter “f”) is equal to the number of taps/1 second. The frequency of the ticker timer is 60 taps/second. This is because the electricity which comes out of the wall socket is an alternating current (AC) which means that the direction of the current alternates between the electric company towards the socket and the socket back towards the electric company. The ticker timer is designed to make a “tap” each time the current’s direction is reversed.
a. If the ticker timer makes 60 taps/second, then how many seconds elapse between one tap and the next tap? Show your mathematical reasoning to figuring this out.
4. Frequency is the number of taps the ticker timer makes each second. Period is the number of seconds that elapse between each tap. Therefore, f = taps/sec and T = sec/tap
a. Write a mathematical expression which relates frequency (f) to period (T)
f = ______________
5. Look at the following dots taken from a ticker timer and answer the following questions: (Remember the frequency of the ticker timer is 60 taps/second).
a. Is this object moving at a constant speed? How can you tell?
b. How much time has elapsed by dot 1?
c. How much time has elapsed by dot 2?
d. How much time has elapsed by dot 3?
e. How much time has elapsed by dot 4?
f. How much time has elapsed between dot 0 and dot 1?
g. How much time has elapsed between dot 1 and dot 2?
h. How much time has elapsed between dot 2 and dot 3?
i. How much time has elapsed between dot 3 and dot 4?
j. What is the speed of the object at dot 1? Show your math. (answer in cm/sec)
k. What is the speed of the object at dot 2? Show your math. (answer in cm/sec)
l. What is the speed of the object at dot 3? Show your math. (answer in cm/sec)
m. What is the speed of the object at dot 4? Show your math. (answer in cm/sec)
6. The
definition of acceleration is: change in
instantaneous velocity/change in time (Dv/Dt).
In other words, if you start at a velocity of 0 cm/sec and you speed up
to 10 cm/sec in 5 seconds, then you have an acceleration of:
(10
cm/sec – 0 cm/sec)/5 sec = 2 cm/sec2.
Another way to put it is that each second that goes by, you
are going 2 cm/sec faster than you were the second before.
So, after 5 seconds, you are going 10 cm/sec.
Notice the units for acceleration: cm/sec2.
That “squared” over the seconds means acceleration.
Without the “squared”, then you are talking about speed.
Something
else you need to know about accelerating objects: If an object starts out at 0 cm/sec and accelerates to 2
cm/sec in one second, its average velocity during that first second is:
(2 cm/sec + 0 cm/sec)/2
= 1 cm/sec
Why? Because it started out that second going 0 m/sec and by the end of the second, it was traveling 2 cm/sec. Therefore, its average speed is the sum of the instantaneous speeds divided by 2.
OH MY GOODNESS, THIS IS SO IMPORTANT, YOU SHOULD READ IT AGAIN AND AGAIN!:
After the first second, the instantaneous speed is 2 cm/sec.
After the first second, the average speed is 1 cm/sec.
After the first second, the distance the object has fallen is 1 cm.
What does all of this mean? Well, if you look at your ticker tape and the dots which are on it, the distance between each dot represents the distance the object has fallen due to the average speed. (remember, at dot 0 it is travelling at 0 cm/sec, but by dot 1 it is travelling at 2 cm/sec. Yet it had to speed up to get to 2 cm/sec. Its average speed between dot 0 and dot 1 is 1 cm/sec. Therefore, after one second, the object could only fall 1 cm.). To find the instantaneous speed of any of the dots, you would have to multiply its average speed by 2. You find the average speed of any of the dots the same way you found speed for a constant velocity object (see question 5).
Once
you know the instantaneous speed, you
can find the acceleration of the object. Remember
acceleration is change in instantaneous
velocity/change in time. All
you have to do is take each instantaneous
velocity and divide it by the time it took to get to that point from dot 0.
(We will assume that the instantaneous
velocity at dot 0 is 0 cm/sec – that way the change in instantaneous
velocity is equal to the instantaneous
velocity at any given dot). (note: Here
I use the word SPEED and VELOCITY interchangeably.)
Look
at the following dots from a ticker timer and answer the following questions:
ROUND ALL NUMBERS TO TWO NUMBERS AFTER THE DECIMAL POINT!!!!!!!!!!!!!!
NOTE: The time interval
between each dot is 0.0167 seconds (just like a regular ticker timer)
a. Is this object moving at a constant speed? How can you tell?
b. What is the average speed of the object at dot 1? Show your math. (answer in cm/sec)
c. What is the average speed of the object at dot 2? Show your math. (answer in cm/sec)
d. What is the average speed of the object at dot 3? Show your math. (answer in cm/sec)
e. What is the average speed of the object at dot 4? Show your math. (answer in cm/sec)
f. What is the instantaneous speed of the object at dot 1? Show your math. (answer in cm/sec)
g. What is the instantaneous speed of the object at dot 2? Show your math. (answer in cm/sec)
h. What is the instantaneous speed of the object at dot 3? Show your math. (answer in cm/sec)
i. What is the instantaneous speed of the object at dot 4? Show your math. (answer in cm/sec)
j. What is the acceleration of the object at dot 1? Show your math. (answer in cm/sec2)
k. What is the acceleration of the object at dot 2? Show your math. (answer in cm/sec2)
l. What is the acceleration of the object at dot 3? Show your math. (answer in cm/sec2)
m. What is the acceleration of the object at dot 4? Show your math. (answer in cm/sec2)
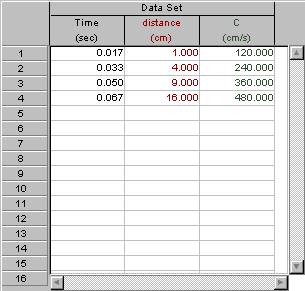
7. You are going to make two graphs from the data of question #6. For each of the graphs, find the slope of the line and tell me what is the significance of that slope. Remember the formula for finding the slope of a line is: y2-y1/x2-x1. You can’t use best fit on Graphical Analysis to find the slope since it changes between each point. But you may use Graphical Analysis to plot the points so you can see them.
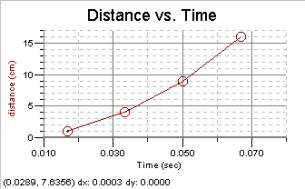
a. The first graph is distance vs. elapsed time. Plot the distance between dot 0 and dot 1 and the time it took to get to dot 1. Plot the distance between dot 0 and dot 2 and the time it took to get to dot 2 (from dot 0). Plot the distance between dot 0 and dot 3 and the time it took to get to dot 3 (from dot 0). Plot the distance between dot 0 and dot 4 and the time it took to get to dot 4 (from dot 0).
Don’t forget to find the slope of the line(s) at each point on your
graph. You can use the TANGENT function on GA to help you do this! – you will find
that the slope is not constant and changes between each point.
Please give me each slope between each
dot and write the slopes in the text box provided on GA. You can
COPY/PASTE this into your final document if you wish
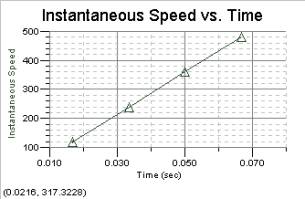
b. The second graph is instantaneous speed vs. elapsed time. Use the slopes you found between each point of your previous graph (those slopes are the average speeds, right? So, you will have to double them to plot this graph). And plot them vs. elapsed time (you may use the exact same data you used for the x-axis in question 7a. The elapsed time is the same).
Don’t forget to find the slope of this line. You should find the slope to be constant. What does this mean? You can use Graphical Analysis and do a best fit. Remember that M is slope!
----------------------------------------------------------------------------------------------------------------------
This is the end of the Pre-Lab. What follows is the actual lab itself
Determining
the Acceleration due to Gravity
Ticker timer Lab:
Procedure: Tape a mass to the end of a length of ticker tape.
Load the ticker tape timer so that the mass is just hanging over the edge
of the table. Start the timer and
let it drop to the floor. Look at your tape and label each point (starting with
“0”) and go out to dot 15. Then,
fill in the data chart below:
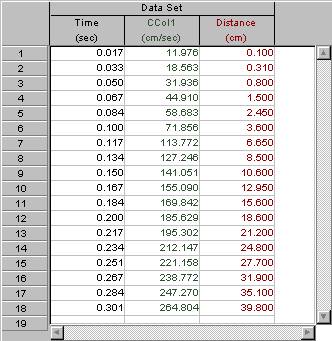
Data: (Note
to student: You can do this
in an excel spreadsheet and then cut/paste it to your final lab report)
PLEASE
REMEMBER YOU MEASURE FROM DOT 0 TO THE DOT IN QUESTION!
Distance from
Time
elapsed from
Average speed at
Inst.
Speed at this
Dot 0 to dot (cm)
dot 0 to dot (sec)
this dot (cm/sec)
dot
(cm/sec)
Dot #
1
2
3
4
5
6
7
8
9
10
11
12
13
14
15
16
17
18
19
20
|
|
Graphs:
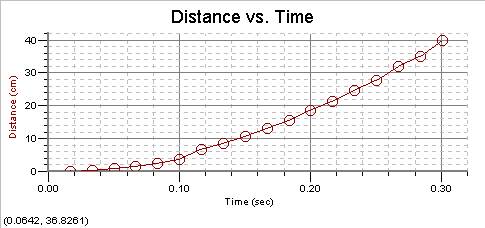
1. Make a graph of
distance vs. elapsed time (remember the line will not be straight, but if you
were to determine the slope of the line between each point you would find the
slope equal to the average speed at
this dot). You do not need to find these slopes! Refer to pre-lab question 7a. if you are having trouble
constructing this graph. Make sure
that your print out looks like the format I showed you in the pre-lab section.
Neatness and organization count!
2.
Make a graph of instantaneous
speed vs. time. (Remember that this
line WILL be straight and will have a constant slope – it might be somewhat
off due to laboratory error, but it should be fairly straight).
What is the slope of this line.
You may use Graphical Analysis and do a linear “best fit” to help you
determine the slope.
Questions:
1. Why is the instantaneous speed at any dot exactly double the average speed at that dot?
2. Come up with a mathematical expression so that you could find the acceleration (a) of an object if you knew the distance between the dots and the time between the dots (d = distance, t time). Hint: You’ll need only the three letters a,d,t and the number 2 in your answer!
a = ?
3. Algebraically re-arrange the equation you created in question #2 to solve for the distance the object falls?
d = ?
4. What is the numerical result of your slope of instantaneous speed vs. time? (units will be cm/sec2)
5. Convert this numerical result into m/sec2.
6. What does this slope value tell you about falling objects on Earth?
7. Would you rather catch that falling mass after it has fallen 2 feet or after it has fallen 200 feet? Why?
8. Do you think that mass will accelerate to an infinitely high speed if it is let drop from a high enough spot (say Mt. Everest to the ocean or from a passing Jet Airliner?) Why?
9. True or False: An object moving at a constant speed (or velocity) has the same average speed as its instantaneous velocity.
10. True or False: an object which is undergoing constant acceleration has the same average speed as its instantaneous speed.