Ticker Timer Answers
25 Neatness 1. Pre-Lab
30 Pre-lab questions 2. Graphical Analysis for #7a and b from Pre-lab
15 Graphical Analysis 3. Graphical Analysis for lab data
30 Post-lab questions 4. Post Lab Questions
Pre-Lab
1a. Dots are widely spaced
2a. Dots are close together
3a. 1/60 = 0.0167 seconds between each tap
4a. T = 1/f or f = 1/T
5 points 5a-i
5a. Constant speed. Dots are evenly spaced.
b. 1/60
c. 2/60 or 1/30
d. 3/60 or 1/20
e. 4/60 or 1/15
f. 1/60
g. 1/60
h. 1/60
i. 1/60
5 points 5 j-m
j. 119.76 or 120 cm/s
k. 120 cm/s
l. 120 cm/s
m. 120 cm/s
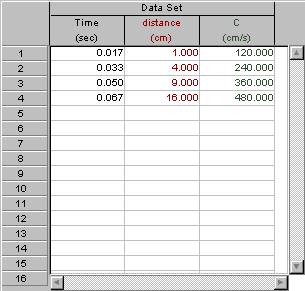
5 points 6 a-e
6a. No, the dots are not evenly spaced. It appears to be speeding up.
b. 60
c. 120
d. 180
e. 240
5 points 6 f-i
f. 120
g. 240
h. 360
i. 480
5 points 6 j-m
j. 7200 cm/s
k. 7200 cm/s
l. 7200 cm/s
m. 7200 cm/s
Graphical Analysis for Question 7a and 7b for pre-lab (5
points for this section)
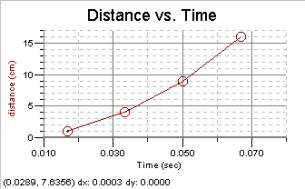
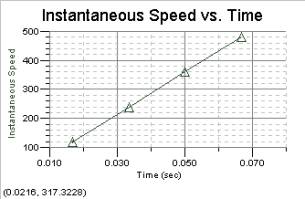
Notes:
Slope at first point = 179.64
Slope at second point = 239.52
Slope at 3rd point = 359.281
Slope at 4th point = 419.162
Slope is constant at 7185.6
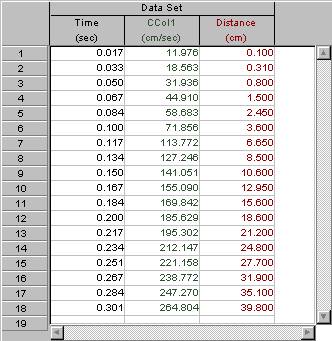
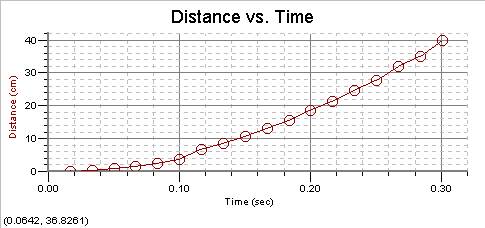
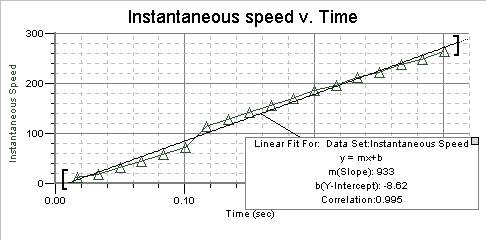
Graphical Analysis for Real Data (example given here is
data taken by Mr. Young)
(15 points for this section)
Post-Lab Questions (3 points each – 30 points total possible this section)
1. The tape at dot 0 is moving at 0 cm/sec. By dot 1, the tape has sped up to its instantaneous velocity. The distance traveled is then equal to the initial velocity and the final velocity divided by 2.
2. a = 2d/t2
3. d = 1/2 at2
4. Answers around 500 – 900 cm/s2 are accepted
5. Answers around 5.00 to 9.00 m/s2 are accepted
6. Objects fall to Earth at a rate of 9.8 m/s2
7. After 2 feet, it has hardly accelerated
8. No. Air resistance will begin to slow it down
9. True
10. False