Rocket Lab
Equations
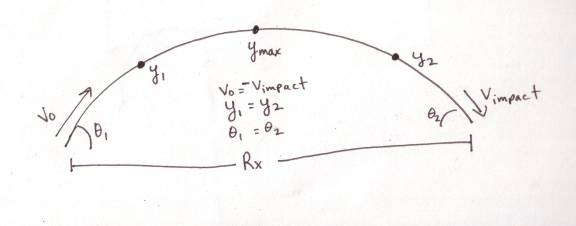
You will want to have:
Vertical
Displacement:
Y
= Voyt - 1/2gt2 (Realize
this is a quadratic and you will have two different times when you solve for it.
The lower time will be the Y point on the UP part of the parabola, the
higher time will be the Y point on the DOWN part of the parabola.
Also realize that since I used a MINUS sign in the equation, that g =
+9.8m/s2)
Vy
= Voy – gt (where
t = the time UP – or DOWN – only. NOT
THE TOTAL TIME OF FLIGHT). This is
a good equation to help you determine the time it takes to get to the top of the
arc since Vy at that point will be 0 m/s
V2
= Vo2 – 2gy (helpful for finding maximum height (y)
where V = 0 m/s)
Range
(in the horizontal (x)) direction: Remember,
this equation only works if the take off altitude
is equal to the landing altitude – as it is in this lab.
Rx
= (Vo2 Sin2q
Procedure:
Questions: (these are written in the order in which you should do them.
Sometimes you need the answer from one to solve later ones)
NOTE: For questions 7-10, you need to understand the following idea: When we were outside launching rockets, we took three types of measurements: Time, Distance (horizontal) and angle of launch. In reality, all you need is any of the two of those to figure out the other one. Therefore, what we are going to do in questions 7-10 is ASSUME we didn't take one of those measurements and then figure it out by calculating it. Then we will find the percentage error between our calculated value and the one we measured in the experiment.
% error =( ½calculated value – experimental value½/calculated
value) x 100
13. Which would make the rocket go further in the x direction: Launching it at a 45o angle (as you did in question #11) or launching it horizontally off of the cliff (at an angle of 0o)? SHOW YOUR WORK! DRAW A PICTURE! HINT: Look at p. 157 of your textbook.
14. Where would the paths of the rockets intersect? For example, if you launched one at 45o and one at 0o, where would their paths cross? a) before they drop below the launch horizon or b) after they drop below the launch horizon. HINT: Look at p. 157 of your textbook. And think about throwing a rock at a 45o vs. a 0o angle on a level field.
15. Which rocket is in the air longer (time wise) the 45o launch or the 0o launch (realize they are launched with the same Vo)
Graphing
Section:
1.
Assume you are going to shoot the rocket at the Vo you
determined in question #1 (of the questions section) at the following angles:
0o, 10o, 20o, 30o, 40o,
45o, 50o, 60o, 70o, 80o
and 90o. Determine the Range (x) for each of these values of q. Use
GA and make one column called q. Then, make a calculated
column so that you can just enter the angle q
and get the Rangex as your result.
You must tell GA that you are using DEGREES and not RADIANS!
If you don’t know how to do this, look at my on-line tutorial for GA.
When you are done, make sure you write the formula you used for the calculated column in the "notes" section of the GA - or if you are embedding your GA in an MS Word document, write the formula near the graph. When I say write the formula, I mean write it EXACTLY as you wrote it in the calculated column, don't give me the formula as it is written in the book. Example: if the formula called for you to double the x and square it, you would write: (2*"x")^2. Notice the quotation marks around the x. Whenever you do some mathematical calculation to a column, that column is in quotation marks. (What I am trying to get at here is to see if indeed you know how to use GA to make a calculated column of numbers or if you are just plugging the angles into your calculator and working out the distances by hand. Shame on you if that is what you are doing! GA is such a wonderful tool!)
What
is due for this lab?:
In
this order please!
1.
Excel data table with average calculated (if I gave you the average data,
you don't need to do this part).
Notice that you need to include q,
x and ttotal in your table. (see PROCEDURE 3)
2.
Answer questions 1-15 and show your work!!!!!!!!!!!!!!!
3.
GA for Graphing section. What
I want to see is a calculated column on one side and the graph on the other.
Be sure to title your graph and its axis’
15
points neatness
60
points #1-15 questions
25
points GA and Excel (if Excel is needed)