Charles Law Lab
Quantitative – 50 points
Purpose: To find
absolute zero. The temperature at which
all molecular motion stops.
Pre Lab Questions:
1. Temperature is a measure of the average ___________ of molecules.
2. A very massive gas molecule traveling at the same velocity as a
lighter gas molecule will have a greater
or lesser kinetic energy?
3. What is the mathematical formula for kinetic energy (abbreviation
KE)? (look on p. 304)
4. Explain the difference between the velocity of a gas particle and
its kinetic energy?
5. Air molecules (N2
gas) move at approximately 1150 miles per hour at room temp (25oC). How come we are not annihilated by these
flying air molecules banging into us?
6. At room temperature, are ALL
air molecules moving at 1150 MPH?
Explain.
7. Charles’ law says: If
pressure remains constant, as
temperature decreases, volume ________
8. Assume you have collected 50 mL of air over water in a
container. The water’s temperature is
25oC. At this temperature,
water has a vapor pressure of 3.2 kPa.
The TOTAL pressure of the gas
in the container is 760 mm Hg (Patmospheric).
a. What is the
pressure of just the dry gas in kPa? (Pdry gas)
b. Use Boyle’s
Law to solve for a corrected volume of the dry gas: (solve for Vcorrected)
Pdry
gasVuncorrected = PatmosphericVcorrected.
9. Why can you not just assume that all 50 mL of air in the
container (from problem #8) are just air molecules? (look at the table of water
vapor pressures on p. 899 of your textbook if you need help)
10. Assume you have a SEALED
250 mL glass container which contains 0.01 moles of air molecules at
room temperature. You begin to heat it
up over a Bunsen burner. After a few
minutes, you decide to count the number of moles of air in the container. Would you expect to find:
a. less
than 0.01 moles, b. more than 0.01 moles, c. 0.01 moles. WHY?
Would you expect the pressure
inside the container to be:
a. greater than outside air
pressure, b. less than outside air pressure
c. equal to outside air
pressure. WHY?
11. Assume the same thing you did in #10, except this time, the
container has a hole in the top of it.
After you heated it up, Would you expect to find:
a. less than 0.01 moles,
b. more than 0.01 moles, c. 0.01 moles. WHY?
Would you expect the pressure
inside the container to be:
a. greater than outside air
pressure, b. less than outside air pressure
c. equal to outside air
pressure. WHY?
What might be on the Pre-Lab Quiz?
How hot should the water be in the 600 mL flask? How do you stabilize the water temp? Should the Erlenmeyer flask be wet inside or completely dry?
Lab Table Set-up will look like:
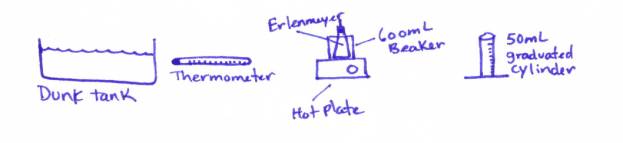
Procedure:
1. Fill your 600 mL beaker with about 250 mL of water - not necessary to be EXACT.
2. Heat the
water to a temperature between 70oC and 90oC. Let the water stabilize (turn off the heat
when you reach between 70-90oC.
This will let it stabilize)
3. Place your EMPTY (NO WATER IN IT!!! AND IT SHOULD BE VERY DRY INSIDE!!!!!!)
Erlenmeyer flask into the 600 mL beaker so that it touches the bottom (but do
not block the tube coming out of the rubber stopper). You will have to hold the Erlenmeyer flask in the water. Hold it down by putting your fingers on the
rubber stopper.
4. Allow the Erlenmeyer flask to heat up for about 2 minutes.
5. Record the temperature
of the water at the end of these 2 minutes as T1.
6. Place your finger over the tube and remove the Erlenmeyer flask
from the beaker of hot water 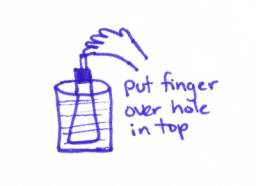
7. Turn the Erlenmeyer flask upside down in the bucket of water
provided at your table. When the neck
of the flask is in the water, remove your finger from the tube. (See drawing
A below)
Watch the water rush in! Whoopee!!!!!!
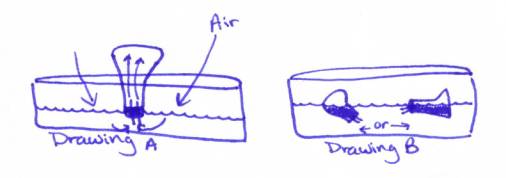
8. When the water stops rushing in equalize the pressure (see drawing B above). Make sure you equalize the pressure by
allowing the water level in the Erlenmeyer flask to equal that of the water in
the tank.
9. Once the pressure has been equalized, put your finger over the
hole in the glass tube and remove the flask from the water. Take off the rubber stopper and take the
temperature of the water in the Erlenmeyer flask. Record this as T2.
10. Pour that water out of the Erlenmeyer flask and into a graduated
cylinder to record its volume. Record this as Vwater. You
can then throw that water away. You
don’t need it.
11. Now, fill the empty Erlenmeyer flask up to the top with
water. Place the rubber stopper into
the
Erlenmeyer so that the water fills
the glass tube in the rubber stopper.
Pour this water out into a graduated cylinder to record its volume. Record
this as V1.
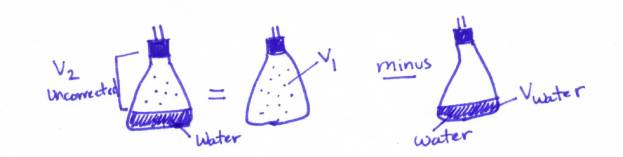
12. Determine the V2 of gas (V2 is the amount
of gas after the temperature is decreased from T1 to T2),
use the following equation: V2
= V1 - Vwater. Record as V2uncorrected on your Data Table.
PLEASE READ THIS BEFORE RECORDING ANY DATA: THE DATA TABLE NEEDS TO BE DONE ON A SEPARATE
SHEET OF PAPER. NEATNESS COUNTS —
REMEMBER YOU ARE GOING TO DO THIS EXPERIMENT AT LEAST THREE TIMES, THAT MEANS
YOU WILL HAVE THREE DATA TABLES AND THREE LINES ON YOUR GRAPH.
Data table: (the stuff in ()’s is there to help you. Don’t include it in your write-up)
V1 _____________mL
T1 ___________oC ______________K
T2 __________oC
______________K
Vwater
____________mL
V2uncorrected _____________mL
Room Pressure ________mm Hg (look on barometer in front of room – multiply by 10 since it
is in cm)
Water’s vapor pressure at T2
______________mm Hg (look on p. 899 of textbook)
Pressure of dry gas alone (Room pressure – Water vapor pressure at T2)
____________mm Hg
V2corrected ________________mL (see calculation #1 for how to figure
this one out)
V1experiment
_______________mL (see calculation #2 for how to figure this one out)
 How
to calculate V2corrected
How
to calculate V2corrected
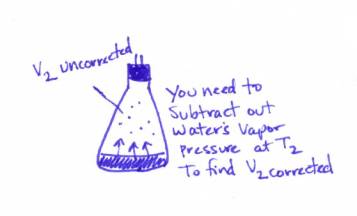
Calculations:
1. You need to calculate the
value of V2corrected. You
may be wondering: What is V2corrected? Well, I’ll tell you: V2corrected is the volume the DRY
GAS would occupy at standard room pressure (760mm or 101.325kpa). The V2 you found by subtracting V1-Vwater
is the volume of BOTH the DRY GAS and the WATER VAPOR (see my beautiful
sketch above). You need just V2
of the DRY GAS. I call this V2corrected
How do you do this?
STEP 1: V2uncorrected = V1-Vwater
STEP 2: Go to the barometer in the front of the room
and find the room pressure in mm of Hg.
Record this as room pressure on your data table (record in both mm of Hg and kPa). This is Patmospheric.
STEP 3: Use the procedure you used in the pre-lab
(question #8). GO BACK AND LOOK AT THAT
QUESTION RIGHT NOW. Do you recall how
to find Pdrygas? (Hint: It has something to do with the barometric
pressure of the room, Subtraction, and the chart on p. 899)
Pdry
gasV2uncorrected = PatmosphericV2corrected.
Record this answer as V2corrected
on your data table.) SHOW YOUR WORK
FOR DETERMINING V2corrected.
2. Using your values for T1, V2corrected
, and T2 (Temperatures in Kelvin!), use Charles’ Law (V2T1=V1T2)
to solve for V1experiment.
Do this for each of your three trials.
Record this answer as V1experiment on your data table. Again, don’t forget your values for temperature
must be in KELVINS when you use Charles’ Law.
What is V1Experiment? Glad you asked…. You found V1 by filling the Erlenmeyer flask
completely with water and dumping it into a graduated cylinder. As it turns out, this is not a very accurate
way to do this. Therefore, to be more
accurate, we use Charles’ Law and the data we collected to get a better value
for V1, I call this better value:
V1experiment. You
should find that the answer you get to this calculation should be pretty darn
close to the one you got from filling the flask with water and measuring it in
the Erlenmeyer flask.
Graph:
Plot a graph of (T1,V1experiment ) and (T2,
V2corrected). The
Temperatures are on the X-axis and the Volumes are on the Y-axis. You will have three lines on your
graph – because you did the experiment three times.
The following will help you plot this graph using a program called
Graphical Analysis.
Charles’ Law Lab
Using Graphical Analysis
1. Find Graphical Analysis on the desktop and
open it.
2. Double Click on the “x” in the x-column of
data. This is in the upper left hand
corner of your screen. VERY UPPER LEFT
CORNER IF YOU PLEASE!
3. Name it “Temperature”
4. Go down to the UNITS and put in “oC”. (Hint:
If you use INSERT SYMBOL, you will find a “o”
5. Click OK
6. Now click on “y” and title it “Volume” with
units of “mL”.
7. Enter your numerical
values for T2 in “x” and V2corrected in “y”. Then enter your numerical
values for T1 in “x” and V1experiment in “y”.
8. Go up to ANALYZE and choose LINEAR FIT. A line should appear through your two points
which tells you the slope.
9. Go up to ANALYZE and choose ZOOM GRAPH
OUT. You want to keep zooming out until
your see the LINEAR FIT line cross the X-axis.
(A cute trick is to click on the magnifying
glass with the negative sign in it on the tool bar along the top.) Notice that the lines DO NOT cross the x axis at 0. In fact, that 0 on the graph represents 0
volume ONLY, it will be a NEGATIVE value for temperature (BELOW zero!)
10.
Once you find the X-Axis intercept, go up to ANALYZE and choose
INTERPOLATE. Now, run your mouse arrow
over the x-axis intercept area and record what value that is. This should be the temperature at which the
volume drops to zero. You will need
this value to answer question #6 in the POST LAB
QUESTIONS
11. Now go up to DATA and choose NEW DATA
SET. A new column of x and y will
appear to the right of your original column of data. Click on these “x”s and “y”s and label them as you did
before. Put in your data for your
second trial here.
12. Move your mouse arrow over to the word
“volume” on the graph. Double click on it. Now you will need to select DATA SET 2 and
check the box for Volume. What you
should see now is two lines on your graph.
If you can’t see both of them, try ANALYZE and AUTO SCALE GRAPH.
13. Go to ANALYZE and LINEAR FIT for the second
set of data. Where does it hit the
x-axis? (HINT: If a box comes up and asks you which lines
you want to linear fit, you just click on all of them and then it will linear
fit each one).
14. Now do this again with your 3rd
set of data.
15. When you are all done, call over Mr. Young
for inspection.
Post-Lab Questions:
1. Find the difference between V1 and V1experiment for each of your three trials. (eg. Subtract the two values)
2. Using PV=nRT you should be able to figure out how many moles of
air were in V1experiment and V2corrected. . You solve for n (which is the
number of moles of gas).
(Do a-c for each of your three data tables. Arrange them nice and neat!
Have a-c for one trial together, then do the next a-c, then the next
one. DON’T mix them all together!)
Here are some values you will
need to solve PV = nRT: R= 0.0821
and P = 1 atm. Temperature is in
Kelvins. The values you will use
for V and for T are given in a-c below.
a. How many moles of air were in V1experiment
at a temperature of T2 (room temp)?
b. How many moles of air were in V1experiment
at a temperature of T1 (hot temp)?
c. How many moles
of air were in V2corrected at a temperature of T2 (room
temp)?
3. What do you notice about the answer to 2b. and 2c? What is significant about these answers?
4. Why did you have to put the Erlenmeyer flask under the water so
that the water levels were equal inside and outside the flask BEFORE you
put your finger over the glass tube and pulled out the flask? What would be the result if you had the
water level in the flask higher than the water in the bucket? What about if it were lower?
5. Why does water come rushing into the flask when you turn it over
into the water? Use drawings to explain
your answer. Remember that the pressure
of the room pushes down on the water.
6. According to your graph, what is the temperature (in Celsius and
Kelvin) at which molecular motion is going to be zero (in other words, zero volume).
7. What is the difference between V2uncorrected and V2corrected. In other words, what do you have to correct
for? I want to know why you have to
correct the volume.
What is due for
this lab?
1. Pre-Lab Questions:
Questions and answers to Pre-lab (you can just copy-paste the questions
from this lab onto a Word file and then type in your answers).
2. Data tables: Three
data tables (one for each trial). You
could just write down all of the information in a column on the extreme left
hand side of your paper and then make three columns titled “trial #1”, “trial
#2” and “trial #3”.
3. Calculations: You
need to do calculations #1 and #2 three times (one for each trial). Please make sure they are separated by trial
so I can easily read them and figure them out.
4. Graph: Plot a graph according to the
instructions. It MUST be on
graph paper. Your axis’ must be labeled
and include numerical values along the axis.
5. Questions: Write the questions and then answer them
(again, COPY-PASTE is the way to go!).
Show your work for #2 – it is a very important question so don’t skip
it!
Overall, neatness
counts! Please do a good job on this lab!