17 Energy in Simple Harmonic Motion
We can describe an oscillating mass in terms of its position, velocity, and acceleration as a function of time. We can also describe the system from an energy perspective. In this experiment, you will measure the position and velocity as a function of time for an oscillating mass and spring system, and from those data, plot the kinetic and potential energies of the system.
Energy is present in three forms for the mass and spring system. The mass m, with velocity v, can have kinetic energy KE
![]()
The spring can hold elastic potential energy, or PEelastic. We calculate PEelastic by using
![]()
In class we often call potential energy (PE) by another letter: U, but it is the same thing.
where k is the spring constant and y is the extension or compression of the spring measured from the equilibrium position.
The mass and spring system also has gravitational potential energy (PEgravitational = mgy), but we do not have to include the gravitational potential energy term if we measure the spring length from the hanging equilibrium position. We can then concentrate on the exchange of energy between kinetic energy and elastic potential energy.
If there are no other forces experienced by the system, then the principle of conservation of energy tells us that the sum
DKE + DPEelastic = 0, which we can test experimentally.
objectives
· Examine the energies involved in simple harmonic motion.
· Test the principle of conservation of energy.
Materials
|
Power Macintosh or Windows PC |
Five 20.0g masses that have hangers on them. one 50.0 g mass with a hanger on it. |
|
LabPro
or Universal Lab Interface |
slotted mass hanger |
|
Logger
Pro |
spring from PASCO carts |
|
Vernier
Motion Detector |
ring
stand |
|
wire
basket |
|
Pre-Lab Questions
1. Sketch a graph of the height vs. time for the mass on the spring as it oscillates up and down through one cycle. Mark on the graph the times where the mass moves the fastest and therefore has the greatest kinetic energy. Also mark the times when it moves most slowly and has the least kinetic energy.
2. On your sketch, label the times when the spring has its greatest elastic potential energy. Then mark the times when it has the least elastic potential energy.
3. From your graph of height vs. time, sketch velocity vs. time.
4. Sketch graphs of kinetic energy vs. time and elastic potential energy vs. time.
Procedure
|
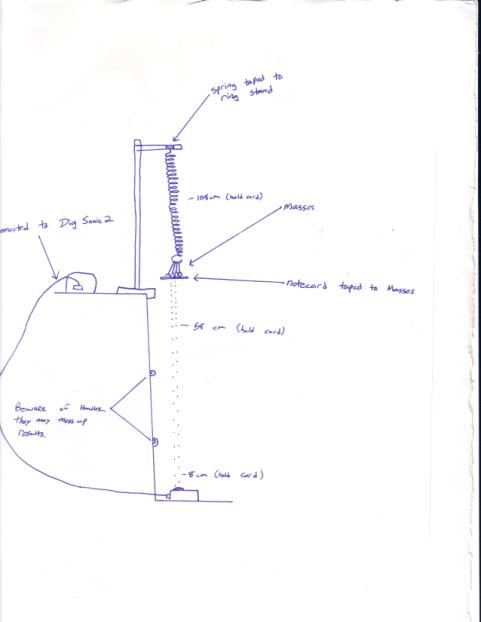
1. Mount the 20-g mass (or you can use up to a 50g mass if you don't get good results. Depending upon the spring you use, you might not get a very good sine wave by using only 20g) and spring as shown in Figure 1. Connect the Motion Detector to DIG/SONIC 2 of the LabPro. Position the Motion Detector directly below the hanging mass, taking care that no extraneous objects could send echoes back to the detector. Protect the Motion Detector by placing a wire basket over the detector. The mass should be about 60-75 cm above the detector when it is at rest. Using amplitudes of 10 cm or less will then keep the mass outside of the 40 cm minimum distance of the Motion Detector. Make sure to tape the spring to the ring stand and the mass to the spring. 2.
Open the Experiment 17 folder from Physics
with Computers. Then open the experiment file Exp 17a Motion Detector.
Two graphs should be displayed on the screen. The top graph is
distance vs. time, with the
vertical axis scaled from 0 to 3. Start
the mass moving up and down by lifting it 10 cm and then releasing it.
Take care that the mass is not swinging from side to side. Click
To
Calibrate:
Hold an object several centimeters above the sensor and press
“zero” under the “experiment” menu. Click “calibrate” under the “experiment” menu. Hold an object at first 0.5 m and then at 1 m and “keep” these data points after waiting for a average value. |
Figure 1 |
4. To calculate the spring potential energy, it is necessary to measure the spring constant k. Hooke’s law states that the spring force is proportional to its extension from equilibrium, or F = –kx. You can apply a known force to the spring, to be balanced in magnitude by the spring force, by hanging a range of weights from the spring. The Motion Detector can then be used to measure the equilibrium position. Open the experiment file Exp 17b Spring Constant. Logger Pro is now set up to plot the applied weight vs. distance.
5.
Click
![]() to
begin data collection. Hang a 20-g mass from the spring and allow the mass to
hang motionless. Click
to
begin data collection. Hang a 20-g mass from the spring and allow the mass to
hang motionless. Click
![]() and
enter 0.196, the weight of the mass in newtons
(N) (0.020 kg x 9.8 m/s2 = 0.49). Press ENTER
to complete the entry. Now hang 40, 60, 80, and 100 g from the spring,
recording the position and entering the weights in N (multiply
their mass in KILOGRAMS!!!!! by 9.8). When you are done, click
and
enter 0.196, the weight of the mass in newtons
(N) (0.020 kg x 9.8 m/s2 = 0.49). Press ENTER
to complete the entry. Now hang 40, 60, 80, and 100 g from the spring,
recording the position and entering the weights in N (multiply
their mass in KILOGRAMS!!!!! by 9.8). When you are done, click
![]() to
end data collection.
to
end data collection.
6.
Click on the Regression Line tool,
![]() , to fit a straight
line to your data. The magnitude of the slope is the spring constant k
in N/m. Record the value in the data table below. USE
THE ABSOLUTE VALUE since K is the same both positive and negative, but the way
the sonic ranger works, we get the negative value for K
, to fit a straight
line to your data. The magnitude of the slope is the spring constant k
in N/m. Record the value in the data table below. USE
THE ABSOLUTE VALUE since K is the same both positive and negative, but the way
the sonic ranger works, we get the negative value for K
7. Remove the 100-g mass and replace it with a 50-g mass for the following experiments.
8.
Open the experiment file Exp 17c Energy. In addition to plotting position
and velocity, three new data columns have been set up in this experiment file
(kinetic energy, elastic potential energy, and the sum of these two individual
energies). You will need to modify the calculations for the energies. Choose Modify Column
![]() Kinetic Energy from the Data menu and substitute the mass of your hanging mass
in kilograms (if you are using the 50.0 g mass, you will enter 0.05 for the value 0.20 in the
definition equation) then click
Kinetic Energy from the Data menu and substitute the mass of your hanging mass
in kilograms (if you are using the 50.0 g mass, you will enter 0.05 for the value 0.20 in the
definition equation) then click
![]() . Similarly, change
the spring constant you determined above for the value 17.8 in the potential
energy equation. Remember, use the ABSOLUTE VALUE OF YOUR SPRING CONSTANT.
. Similarly, change
the spring constant you determined above for the value 17.8 in the potential
energy equation. Remember, use the ABSOLUTE VALUE OF YOUR SPRING CONSTANT.
9. With the mass hanging from the spring and at rest, click zero on the Motion Detector. From now on, all distances will be measured relative to this position. When the mass moves closer to the detector, the distance reported will be negative.
10. Start the mass oscillating in a vertical direction only, with an amplitude of about 10 cm. Click COLLECT to gather position, velocity, and energy data.
11. Click on the y-axis label of the velocity graph (literally, click on the blue word "velocity") to choose another column for plotting. Uncheck the velocity column and select the kinetic energy and potential energy columns. Click OK to draw the new plot. You will also need to click on one of the numbers in the y-axis of velocity and choose "autoscale" because the scale is set too high for you to see any results.
12. Click again on the Kinetic Energy and Potential Energy on the y-axis. If you scroll down the selection box, there should be one marked "total energy". Check this box as well and see what you get on the graph.
13. Click on the y-axis label of the distance graph (literally, click on the red word "distance") to choose to plot "velocity" along with distance. Again, you might need to "autoscale" this one too. What do you notice about the phase shift between velocity and distance?
DON'T LEAVE THE POST-LAB QUESTIONS FOR "HOMEWORK". YOU NEED TO MANIPULATE THE LOGGER PRO GRAPHS AND YOU CAN ONLY DO THAT IN CLASS.
DATA TABLE
|
Spring constant |
N/m |
Post-Lab Questions:
1. Describe the graph created by plotting both KE and PE on the same y-axis. What does this tell you about the Total energy of the system?
Put a copy of that graph here : (KE and PE vs. Time)
2. Describe the graph which was Total Energy vs. Time. What did that one look like and why did it look like this? You might notice that it is a bit "noisy". Can you explain the "noise" - think about the scale
Put
a copy of that graph here (KE and PE and TE vs. time).
3. What do you notice about the Distance and Velocity vs. time graph? How does that graph describe what is going on with velocity as a function of displacement?
Put a copy of that graph here (Distance and Velocity vs. time)
4. Remove the "velocity" from the Distance and Velocity vs. time graph and use the "examine" feature of Logger pro to determine the Period (T) of the pendulum. Recall that the period is the amount of time (in seconds) which elapse between two maximums on the sine wave.
Put a copy of that graph here (Distance vs. time along with the examine feature indicated)
5. What is the frequency of this pendulum (easy!)
6. What is w from your data (show your work)
7. Fill in the red lettered values of this equation with actual numbers from your lab
Yo = A sin (wt + d)
8. Use the "examine" feature of Logger Pro to determine values for Vinstant and Yinstant for the following times
1 second Vinstant __________ Yinstant___________
2 second Vinstant __________ Yinstant___________
3 second Vinstant __________ Yinstant___________
4 second Vinstant __________ Yinstant___________
9. Use the equation Etotal = KE + PE = 1/2mv2 + 1/2ky2 to see if each of the values you found in question number 8 equals the same total energy. Make sure you show your work for each value and indicate if it is for second 1, second 2, second 3 or second 4.
What is due for this lab:
1. Pre-lab Questions
2. Data Table
3. Graphs created on LOGGER PRO. Use the ones specified in the procedure and in the post-lab questions.
4. Post-Lab Questions
Send it to me on e-mail as "gy17EnergySHM" where "gy" are the initials of the person writing this lab.
gyyoung@capousd.org